LODGING MARKET INSIGHTS & TRENDS
UPDATE: Q1 2023

Market Overview
Despite a largely recovered global lodging industry, we are still operating in a “VUCA” (Volatile, Uncertain, Complex, Ambiguous) environment that will remain well into 2023
In Q1 2023, the lodging market has experienced a significant increase in market rates across many regions, especially in popular tourist destinations and business hubs. The rapid rebound of business travel after nearly all COVID-19 related travel restrictions, including China, have been lifted has contributed to this growth. Now that the “Health and safety” topic is mostly restored, the top three concerns of corporates are now the high costs of travel, disruptions due to labor shortages and the economic headwinds of a recession.
While many hotels and other lodging establishments experiencing an increase in occupancy rates, driven by increasing demand from businesses and individuals alike, supply is still limited. This makes it difficult for Procurement & Travel Managers to keep business travel expenses within budget, whilst ensuring exceptional digital traveler experiences and contributing to sustainability targets.
In this update, we will dive deeper into the latest developments in the lodging business travel market and analyze the current challenges faced by the industry. We will also explore the latest trends and insights, including changes in customer behavior and expectations, as well as technological advancements that are reshaping the industry.
Average Daily Rate (ADR) in Top 12 Corporate Markets 2022 vs. 2021
Despite double digits market rates increase across the world in 2022, HRS Customers were largely protected from rate increases

Global average across all markets was 33% vs. HRS average across all markets 14,2%.
Source: Rategain, Booking.com. Expedia.com, Chain Hotel website direct, HRS Customer average booked daily rate
In 2022, we have seen a massive increase of 38% in ADR across the Top 12 Corporate Markets, led by Singapore (61%), Australia (53%) and the United States of America (45%). HRS customers were largely protected from massive market rate increases through a combination of smart negotiations, continuous optimization and multisource technology ensuring only the most relevant, strategy-compliant hotels with best available rates from various content sources are displayed to the traveler.
Curious how you can achieve the same results?
Talk to our Procurement Experts
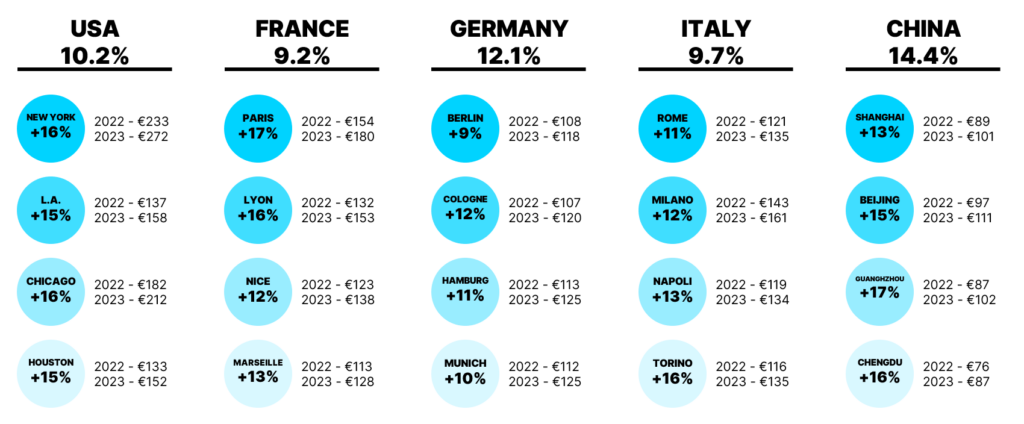
Average Daily Rate (ADR) in Top Travel Destinations 2022 vs. 2023 YTD
Major increases in ADR lead to increased pressure on negotiations
Going one level deeper and looking at the main travel destinations in Germany, France, Italy, the U.S. and China, we see the following developments:

Source: Rategain
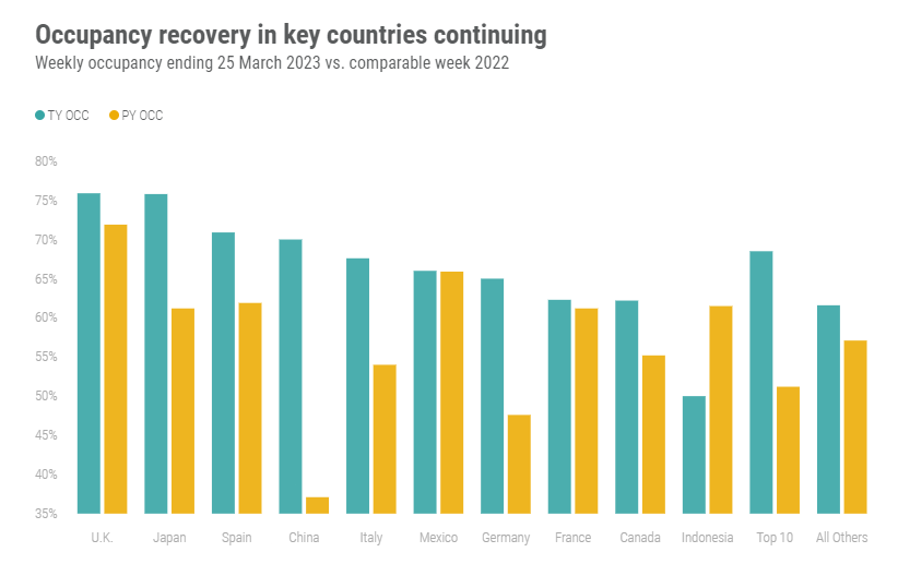
Weekly Occupancy

Last year, the ADR grew exponentially. This was primarily due to several macroeconomic factors as occupancy rates were not yet back at 2019 levels, even though the ADR was. In contrast, the graphs above suggest that the occupancy level has now increased and will put further pressure on ADR in addition to the following key factors contributing to these sharp increases:
ADR Forecast 2023
Rate increases are expected to continue to occur
The lodging market is expected to continue its recovery in 2023, with demand expected to remain strong. However, supply constraints and labor shortages are expected to persist, which could limit the pace of growth in the industry. As a result, the market rates for lodging are likely to continue to increase, albeit at a slightly slower pace than in Q1 2023.

Source: Rategain, Booking.com. Expedia.com, Chain Hotel website direct
Therefore, it is essential for Procurement and Travel Managers to work with accurate destination demand forecasts to have greater visibility into future demand for lodging in destinations in their Procure2Book lifecycle and the impact that this might have on their program and savings – identifying areas of opportunity and risk for continuous procurement opportunities as well as optimising transient, long stay and M&G budgets.
HRS provides customers with destination intelligence data (Destination Demand Index & Event Calendar) for an unlimited number of locations (be it for an individual hotel, a point of interest, a sourcing destination or longitude/ latitude coordinates) where we can quickly see at a glance what events are impacting demand in that destinations 6 months in advance. This will lead to increased procurement outcomes as we understand the rates offered and blackout dates in the context of demand in that location – means negotiations can be targeted, M&G planning can be optimized to fall outside of peak demand periods or outside of demand surge destinations and travelers can reschedule their trips to take advantage of quieter periods and lower rates.
What other market trends are creating uncertainty and volatility in the business travel market?
Increase in fuel costs up to $222b
The global airline industry’s fuel bill reached USD221.8 billion in 2022, (accounting for ~30% of operating expenses), an increase of 115%. Industry net losses of US$6.9B in 2022 driving continued airfare increases and therefore more purposeful travel.
500,000+ Flight Cancellations
Flight cancellations and disruptions have more than tripled when compared with 2019 due to the faster-than-expected recovery in air travel and the massive staffing shortage at airports and airlines. Disrupted travel is now the #1 traveler concern.
Learn more about our HRS Crew & Passenger Solutions to be able to deliver exceptional experiences to your employees when a flight got cancelled or disrupted.
Other complexities in managing lodging programs in 2023
Curious how you can create exceptional digital & simple traveler experiences?
The recent developments in ADR, weekly occupancy rates as, demand recovery as well as the macroeconomic and business travel related market trends lead to the conclusion that the need for smart negotiations is higher than ever. That is why now is exactly the right time for companies to adapt their strategy by exploring alternative options and using technology to help manage expenses and streamline the travel process to manage spend holistically and keep travelers in the managed booking channels to increase buying power, optimize spend and increase traveler satisfaction.
3 Tips on how to succeed in Business Travel Procurement & Program Management
Secure purchasing power by leveraging converged spend
As many travel budgets got reduced, companies lost between 20 %to 40% of volumes and therefore negotiation power. Did you know that 40% related to hotel spend is often not yet managed in a dedicated program? To compensate for the loss in volume on transient it is a winning strategy to converge segments such as meetings, groups, and long-stay bookings in one RFP to increase overall buying volume in the sellers’ market. A converged program will deliver overall savings of more than 9% on average, create spend transparency across all lodging segments and therefore mitigate risk.
Set the right program priorities to optimize spend
Procurement managers do not only need to include strategic added values such as sustainability, traveler safety, destination security and traveler satisfaction in their program to ensure maximum adoption and corporate governance. In order to increase efficiencies, they have to prioritize and weight these factors to determine the optimal hotel portfolio for their company based on spend data and preferences as well as continuously check and adjust their hotel portfolio along strategic target KPIs.
Monitor your program in real-time based on spend data & supplier performance indicators.
Monitor your program in real-time based on spend data & supplier performance indicators
As the market is very dynamic and market trends, traveler behavior and preferences are constantly changing, travel managers need to ensure continuous optimization of their procured lodging program based on the travel patterns of the corporate as well as the compliance and performance of negotiated properties within the program. Therefore, Post-RFP-KPIs need to be fed back to your suppliers in order to give them recommendations for improvements to maximize availability and satisfaction.
Find out how HRS can help you to boost your procurement performance!
180 mio
Room nights sourced
-16%
HRS ADR savings vs. market 2022
+23%
Program Adoption average increase
